
- Home
- DFW Market Intelligence
- Dallas-Fort Worth Commercial Real Estate Market
Dallas-Fort Worth Retail Real Estate Market Profile
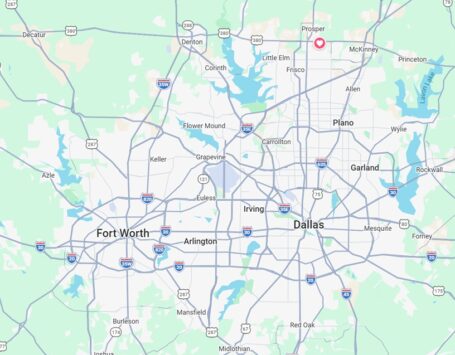
Last updated July 6, 2026, by Joseph Gozlan, Managing Principal of Eureka Business Group, a Dallas-Fort Worth retail investment sales brokerage.
Quick Recap
Dallas-Fort Worth is the fourth-largest metro area in the United States, with a population near 8.5 million people spread across 13 counties anchored by Dallas and Fort Worth. As of the second quarter of 2026, the DFW retail market holds 471.9 million square feet of inventory at a 5.1 percent vacancy rate, with asking rents up 2.4 percent year over year to $25.47 per square foot. Retail construction remains active at 7.6 million square feet under way, 75.8 percent of it pre-leased, while retail sales volume over the trailing 12 months reached roughly $1.4 billion at an average cap rate of 6.4 percent. Grocery-anchored centers and net lease properties near population growth corridors such as Collin County, Frisco, and McKinney continue to draw the strongest investor demand.
Dallas-Fort Worth Metroplex Passport
Before evaluating retail fundamentals, it helps to understand the metro itself. The Dallas-Fort Worth metroplex is the economic and population engine behind North Texas retail demand, and its growth trajectory explains much of what shows up in the leasing and sales data further down this page.
| Category | Figure | Source |
|---|---|---|
| Metro area name | Dallas-Fort Worth-Arlington Metropolitan Statistical Area (the Metroplex) | U.S. Census Bureau |
| Population (metro) | Approximately 8.5 to 8.6 million residents | CoStar/Oxford Economics, 2026; U.S. Census Bureau, 2024 |
| National population rank | 4th-largest metro area in the U.S., largest in Texas and the South | U.S. Census Bureau |
| Counties in metro | 13 counties, anchored by Dallas and Tarrant counties | CoStar/Oxford Economics |
| Population growth since 2010 | About 27 percent, with Collin and Denton counties each growing more than 50 percent | CoStar/Oxford Economics |
| Households | Roughly 3.1 million | CoStar/Oxford Economics |
| Median household income | $95,388, about 12 percent above the national median of $84,881 | CoStar/Oxford Economics |
| Labor force | Approximately 4.56 million | CoStar/Oxford Economics |
| Unemployment rate | 4.2 percent, below the 4.5 percent national rate | CoStar/Oxford Economics |
| Fortune 500 headquarters | 24 companies, including Texas Instruments, AT&T, American Airlines, Kimberly-Clark, Toyota, and McKesson | CoStar/Oxford Economics |
| Anchor industries | Financial services, logistics and transportation, defense and aerospace, healthcare, technology, energy | CoStar/Oxford Economics |
| Key infrastructure | Dallas Fort Worth International Airport, along with the I-30, I-20, and I-35W/I-35E highway network | Wikipedia, Dallas-Fort Worth metroplex |
For context on how this region compares nationally, the metroplex has been described by demographers as the fastest-growing large metro area in the country over the past decade, a trend that continues to push new retail rooftops into outlying submarkets well beyond the Dallas and Fort Worth city cores.
Overview: DFW Retail Market Conditions, Second Quarter 2026
Dallas-Fort Worth retail fundamentals remain balanced but have cooled from the elevated pace of the prior cycle. The market delivered 5 million square feet of new retail space over the trailing 12 months against 2.9 million square feet of net absorption, pushing the vacancy rate to 5.1 percent. Market asking rent growth slowed to 2.4 percent year over year, the weakest pace in more than a decade, though still above the national average.
Bankruptcy-related closures among several national retailers created backfill opportunities in power centers across the metro during the past year, temporarily lifting vacancy. Most of these vacated spaces have been absorbed quickly by larger tenants and expanding retailers, often improving the co-tenancy mix at the properties involved. At the same time, new supply has outpaced demand on a rolling four-quarter basis, with the gap peaking in the third quarter of 2025 when new deliveries ran roughly twice net absorption. That imbalance has been concentrated almost entirely in older, lower-rated properties rather than in new, well-located centers, which continue to lease up at 70 percent or higher before delivery.
Leasing Trends
Leasing activity has moderated as 2026 began, with fewer executed deals and smaller average tenant footprints. Average deal sizes have contracted by roughly 15 percent over the past year, reflecting a shift toward service-oriented tenants that need less square footage. Restaurants led new leasing activity in early 2026, and fitness concepts and discount chains have absorbed much of the space left behind by last year’s national store closures, frequently at higher rents.
Notable recent closures include Weir’s Furniture and the remaining Salad & Go locations in North Texas, following an earlier wave of Salad & Go closures in 2025. Spaces under 1,000 square feet, the format many quick-service users occupy, saw vacancy nearly double in the most recent quarter, though brokers report that well-located pads are still drawing interest from other tenants even when the original user vacates.
Grocery-anchored development remains a leasing catalyst throughout the metro. H-E-B has opened 19 stores across North Texas since 2021, and retail space within a quarter mile of those stores is running near 98.3 percent occupied, close to full. That pattern supports one of the clearer investment theses in this market: proximity to a strong grocery anchor continues to compress vacancy and support rent growth even as the broader market cools.
Rent Trends and Mark-to-Market Opportunity
Market asking rent reached $25.47 per square foot in the second quarter of 2026, up 2.4 percent year over year. Over the past decade, cumulative asking rent growth in Dallas-Fort Worth has reached 43.3 percent, which has left meaningful spread between in-place rents on older leases and current market rents on comparable space.
Two examples from the CoStar report illustrate the scale of that spread. At Midlothian Towne Crossing, a JOANN lease signed in 2018 at $11 per square foot NNN was later re-leased to Cavender’s at $21 per square foot NNN, an increase of nearly 90 percent. At 380 Towne Crossing in McKinney, Cavender’s replaced a former Party City space at $22 per square foot NNN. New first-generation space of 5,000 square feet or less is now leasing between $35 and $40 per square foot, compared with a typical range of $20 to $25 per square foot for buildings constructed in or before 2019, a gap of roughly 65 percent. New grocery-anchored developments are commanding even higher starting rents, generally between $45 and $55 per square foot depending on the anchor.
For owners with vacancy to backfill, this spread represents one of the more reliable value-add levers in the current cycle. For 1031 exchange buyers evaluating in-place NNN leases, it is also a reminder to check how a seller’s current rent compares with what the space could achieve today, since a below-market lease can understate the property’s forward income potential.
Construction Activity
The Dallas-Fort Worth retail construction pipeline totaled 7.6 million square feet across 292 buildings as of the second quarter of 2026, representing about 1.6 percent of existing inventory and roughly 12 percent of the entire national retail construction pipeline. Of that pipeline, 75.8 percent is pre-leased, reflecting how disciplined lenders have become. Most developers report that projects do not move forward without 70 to 80 percent pre-leasing or a committed build-to-suit tenant.
Construction activity is concentrated in the growth corridors north of Dallas and Fort Worth. North Collin County Outlying leads the metro with 1.73 million square feet under construction and a 91.5 percent pre-lease rate, followed by West Frisco, Northwest Fort Worth, McKinney, and Frisco. Much of this pipeline consists of grocery stores, auto dealerships, and build-to-suit space for national retailers such as Walmart, Costco, and Home Depot, built to serve expanding residential trade areas rather than to compete directly with existing centers. Demographers project North Texas will surpass Chicago as the third-largest metropolitan area in the country within the next decade, which continues to be the primary driver behind this pace of development.
Sales and Investment Activity
Retail investment sales in Dallas-Fort Worth reached $1.4 billion in trailing 12-month volume, the first time the market has cleared $1.3 billion in confirmed deal volume since 2021. By total square footage traded, the metro ranked just behind Chicago nationally over the same period, with just under 22 million square feet changing hands.
Private buyers still account for most transactions, but institutional investors have grown their share to roughly 15 percent of buyers, nearly double their share five years ago. Blackstone’s acquisition of several North Texas properties as part of its broader Global Fund Investment retail portfolio purchase in December 2025 is one example. Nearly half of the trailing 12-month sales volume traces to a single transaction: the Nasher-Haemisegger family’s acquisition of a 60 percent stake in NorthPark Center from J.P. Morgan for an estimated $560 million, returning majority control of the mall to its founding family.
For single-tenant net lease buyers, pricing varies by tenant category. Quick-service restaurants such as Swig or Dutch Bro’s are trading in the high-5 percent cap rate range, up 75 to 100 basis points over the past several quarters. Traditional fast-food users typically trade between 6 and 8 percent depending on tenant credit and building quality. Grocery-anchored neighborhood centers, the asset type most active among institutional and public REIT buyers, are trading around high-6 percent cap rates, while power centers are generally pricing near 7.5 percent, with co-tenancy restrictions sometimes pushing pricing higher on centers where occupancy is harder to maximize.
Across all retail property types, the trailing 12-month average sale price was $382 per square foot at an average cap rate of 6.4 percent, based on 2,034 sale comparables tracked by CoStar.
What This Means for 1031 Exchange Investors
Investors working under a 1031 exchange deadline are generally underwriting single-tenant net lease deals, and the current data points to a market where cap rates have already expanded from their 2025 low and pricing discipline has returned. Quick-service cap rates in the high-5 percent range, up 75 to 100 basis points recently, mean exchange buyers now have somewhat more room to underwrite than they did a year ago. At the same time, in-place rent should be checked against the mark-to-market spreads described above. A lease signed several years ago at a below-market rate can represent a smaller share of a property’s real earning power than the trailing rent roll suggests, which matters both for near-term cash flow and for exit value down the road.
What This Means for HNW Active Investors
For investors with more flexibility on asset type and hold period, the clearest opportunities in this data set sit in grocery-anchored neighborhood centers and well-located power centers in the metro’s outlying growth corridors. These properties are pricing in the high-6 percent to 7.5 percent cap rate range, offer exposure to population growth that continues to outpace the national rate, and benefit from limited new competing supply given how disciplined current construction lending has become. Multi-tenant assets also carry the added benefit of co-tenancy and repositioning upside, illustrated by relets such as the Big Lots space at Grapevine Towne Center that backfilled with Pottery Barn earlier in 2026.
Frequently Asked Questions
» What is the current retail vacancy rate in Dallas-Fort Worth? The market-wide retail vacancy rate was 5.1 percent as of the second quarter of 2026, up slightly from recent lows as new supply has outpaced demand in lower-rated properties.
» What is the average retail cap rate in Dallas-Fort Worth? The average cap rate across all retail property types was 6.4 percent over the trailing 12 months, based on 2,034 sale comparables. Single-tenant net lease deals for quick-service restaurants trade in the high-5 percent range, while grocery-anchored centers trade around high-6 percent and power centers around 7.5 percent.
» Is retail rent growing in Dallas-Fort Worth? Yes, though growth has slowed. Market asking rent rose 2.4 percent year over year to $25.47 per square foot as of the second quarter of 2026, the slowest pace of growth in more than a decade but still above the national average.
» How much retail space is under construction in Dallas-Fort Worth? Approximately 7.6 million square feet across 292 buildings, representing 1.6 percent of existing inventory. About 75.8 percent of that space is already pre-leased.
» What is the population of Dallas-Fort Worth? The Dallas-Fort Worth-Arlington metropolitan area has a population of approximately 8.5 to 8.6 million people, making it the fourth-largest metro area in the United States and the largest in Texas and the South.
» Which Dallas-Fort Worth submarkets have the most retail construction activity? North Collin County Outlying leads the metro with 1.73 million square feet under construction, followed by West Frisco, Northwest Fort Worth, McKinney, and Frisco, all located in the metro’s high-growth northern corridor.
About This Report
This profile is compiled from the CoStar Group Dallas-Fort Worth Retail Market Report dated July 6, 2026, licensed to Eureka Business Group, along with U.S. Census Bureau and Wikipedia demographic data on the Dallas-Fort Worth metroplex. Eureka Business Group also publishes the Eureka Retail Velocity Index, a monthly proprietary read on DFW retail leasing and pricing trends, available at velocity.ebgtx.com.
Eureka Business Group is a Dallas-Fort Worth retail investment sales brokerage advising 1031 exchange investors and high-net-worth active buyers on single-tenant net lease and multi-tenant retail acquisitions and dispositions across North Texas.
Sources: CoStar Group, Dallas-Fort Worth Retail Market Report, July 6, 2026 (licensed to Eureka Business Group). U.S. Census Bureau population estimates. Wikipedia, “Dallas-Fort Worth metroplex” and “Demographics of Dallas-Fort Worth.”
